The article shows the deep learning segmentation techniques, evaluation metrics, data set requirements, model performance, and findings used in detecting weeds & crops using drone imagery.
Authors: Neha Gupta, Priya KS, Yangyang Cai, and Kathryn Loewen
Omdena collaborators worked with SkyMaps Agrimatics to explore various Machine Learning (ML) models and computer vision techniques to find solutions for reducing the use of herbicides in farming.
Introduction
Agriculture is the most labor-intensive of all economic activities. It provides, directly and indirectly, a source of livelihood for the 7.7 billion population on the planet Earth. The most widespread model of agriculture involves intensive use of farm inputs such as soil, water, fertilizers, insecticides, and herbicides. Agriculture also includes science and technology. Farmers in the modern world use high-tech devices like iPads, laptops, robots, and drones.
Farmers use herbicides to keep weeds from destroying their crops. Aggressive invasive weeds like the Persicaria perfoliata (also known as the Mile-a-Minute weed) can quickly form dense mats that crowd out native species across swaths of land. Herbicide usage is a necessary weapon for reducing these threats, and in turn, for maximizing crop yield. However, these herbicides cause devastating effects to the environment by contaminating soil and water tables, thereby causing adverse effects on organisms, human health, and the overall ecosystem.
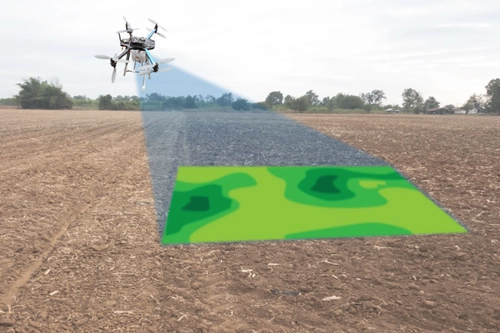
Many modern farming operations are exploring the benefits of employing agricultural robotics that can improve their farming operations. Autonomous drones with cameras installed can acquire aerial photography of farmland by slowly scanning each hectare of land. These UAVs (unmanned aerial vehicles) can also be programmed to dispense herbicides with limited human intervention.
However, these robotics need to be programmed with specific GeoJSON coordinates that instruct them where the herbicide should, and shouldn’t, be sprayed. Most industrial farm operations are on average hundreds of hectares in size. Human review of thousands of image tiles (cut up from massive orthophotos) to label the specific coordinates of where the highest concentration of invasive weeds vs healthy crops is tedious, laborious, time-consuming, and prone to human error.

Orthomosaic image acquired by UAV of sugar cane plantations and its human-generated ground truth. Source
Modern developments in artificial intelligence and agriculture technology, like the use of Computer Vision, can assist farmers in automating this process. A machine learning model that has already been trained to identify specific crops and weeds species can be applied to new data to acquire these coordinates much more rapidly and precisely than humans are capable of. Furthermore, the accuracy of these models can be measured and fine-tuned to ensure herbicide spraying is operating as efficiently as possible. This reduces the overall volume of toxic chemicals being distributed into the environment with the added benefit of reducing farmers’ operational costs. We explore the different types of Computer Vision models that can be used to segment these species.
Segmentation Models
History – Pre Neural Networks
Before the advent of deep learning models, scientists used approaches like Semantic Texton Forest and Random Forest-based classifiers for object class segmentation. Later as the use of Deep Neural Networks (DNN) advanced for image recognition, Convolutional Neural Networks (CNN) achieved enormous success on segmentation problems.
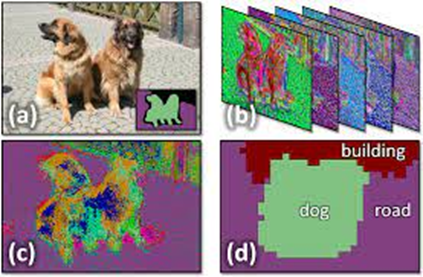
Early attempts at Semantic Segmentation – Source: Shotton et. al circa 2008
One of the popular deep learning approaches was patch classification (Hou et.) where each pixel was separately classified into classes using a patch of images around it. The main motivation for using patches was that classification networks typically have full connected layers and therefore require fixed-size images.
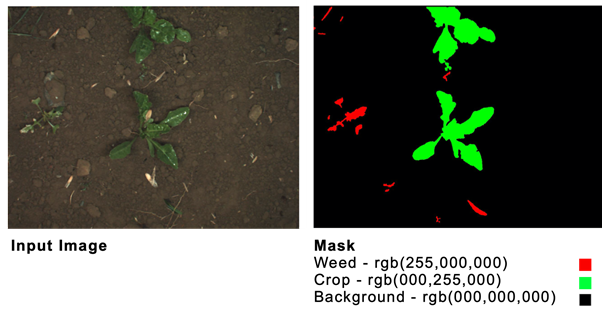
Semantic segmentation refers to the process of linking each pixel in an image to a class label. For example, in the image below, each red pixel is associated with the “weed” class and each green pixel with the “crop” class.
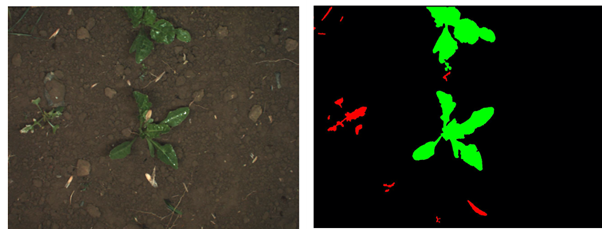
Source: Sugar Beets dataset
In 2014 Long et al. popularized the use of segmentation without any fully connected layers in their academic paper Fully Convolutional Networks for Semantic Segmentation. This improved the segmentation maps generated for images of any size, and the model performed faster compared to the patch classification approach. Almost all the subsequent state-of-the-art approaches on semantic segmentation adopted this paradigm.

U-Net
U-Net was originally developed by Ronneberger et. al. for Biomedical Image Segmentation. The U-Net architecture consists of two main parts or paths: (i) the encoder (ii) the decoder.
The first path is known as the contraction path, which is often used to obtain the context in the image. The encoder consists of a stack of convolutional layers along with max-pooling layers. The decoder of the second path is also known as the symmetric expanding path, which is used for transposed convolutions and to use precise localization. The U-Net is thus a fully connected convolutional layer as it does not contain any dense layer and has only convolutional layers.
The ability of the U-Net to precisely localize the borders present in the image is because it does classification on every pixel as the input and the output have the same size.

Source
MobileNet
MobileNet is a variation of U-Net with a streamlined architecture. It significantly reduces the number of parameters when compared to a network with regular convolutions with the same depth in the nets. This results in lightweight deep neural networks that are more ideal for mobile and embedded vision applications that operate “on the edge” and that may have limited processing power.
EfficientNet
EfficientNet is a convolutional neural network architecture and scaling method that uniformly scales all dimensions of depth/width/resolution using a compound coefficient. Unlike other conventions that arbitrarily scale these factors, the EfficientNet scaling method uniformly scales the dimensions using a set of fixed scaling coefficients. The compound scaling method is justified by the intuition that if the input image is bigger, then the network needs more layers to increase the receptive field, and more channels to capture more fine-grained patterns on the bigger image.
SegNet
SegNet: A Deep Convolutional Encoder-Decoder Architecture for Image Segmentation (Badrinarayanan et. al) is another iteration of semantic segmentation motivated by reducing training time through memory optimization. Architectures that store the entire encoder network feature maps perform best but consume more memory during inference time. SegNet, on the other hand, is more efficient since it only stores the max-pooling indices of the feature maps and uses them in its decoder network to achieve good performance. On large and
well-known datasets SegNet performs competitively, achieving high scores without memory versus accuracy trade-offs associated with achieving good segmentation performance.
Mask R-CNN
In 2017 He et. al introduced a new type of segmentation, instance segmentation, with the publication of Mask R-CNN. Mask R-CNN is an extension of the Object Detection algorithm Faster R-CNN with an extra mask head. The extra mask head allows us to pixel-wise segment each object and also extract each object separately without any background (which is not possible by semantic segmentation). Mask R-CNN can separate different objects within images or a video. Mask R-CNN can identify the object bounding boxes, classes, and masks within an image.

Source
Evaluation of Semantic Segmentation Models
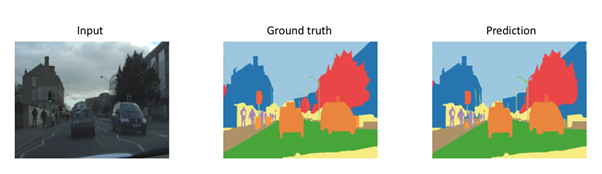
Recall that the task of semantic segmentation is simply to predict the class of each pixel in an image.
Common ways to evaluate semantic segmentation model performance include:
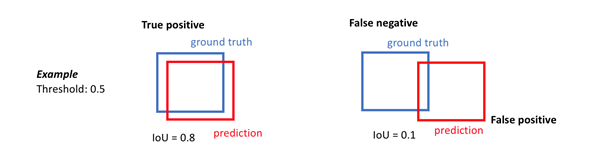
Intersection Over Union (IoU)
IoU is the area of overlap between the predicted segmentation and the ground truth divided by the area of union between the predicted segmentation and the ground truth. This metric ranges from 0–1 with 0 signifying no overlap and 1 signifying perfectly overlapping segmentation. For binary (two classes) or multi-class segmentation, the mean IoU of the image is calculated by taking the IoU of each class and averaging them. IoU is generally considered the leading indicator for a semantic segmentation model’s performance.

Dice-Coefficient
Dice coefficient is a spatial overlap index and a reproducibility validation metric and has scores ranging from 0 (which indicates no spatial overlap between two sets of binary segmentation results) to 1 (which indicates complete overlap). It is used to measure the similarity of two samples. It is calculated as 2 * the Area of Overlap divided by the total number of pixels in both images.
Pixel Accuracy
Pixel accuracy is the most basic metric which can be used to validate segmentation results. Accuracy is obtained by taking the ratio of correctly classified pixels with regards to total pixels
Pixel Accuracy = (TP+TN)/(TP+TN+FP+FN)
The main disadvantage of using such a technique is the result might look good if one class overpowers the other. Say for example the background class covers 90% of the input image. We can get an accuracy of 90% by just classifying every pixel as background.
Frequency Weighted IOU
This is an extension over mean IOU which we discussed and is used to combat class imbalance. If one class dominates most parts of the images in a data set like for example background, it needs to be weighed down compared to other classes. Thus, instead of taking the mean of all the class results, a weighted mean is taken based on the frequency of the class region in the data set.
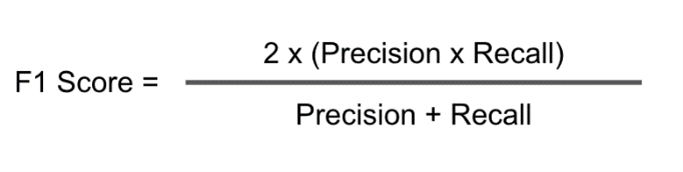
F1 Score
F1 score is the metric popularly used in classification, F1 Score can be used for segmentation tasks as well to deal with class imbalance.
Evaluation of Instance Segmentation Models
Instance segmentation models are more complicated to evaluate. Semantic segmentation models output a single segmentation mask, whereas instance segmentation models produce a collection of local segmentation masks describing each object detected in the image. For that reason, evaluation methods for instance segmentation are quite like that of object detection, with the exception that we now calculate IoU of masks instead of bounding boxes.

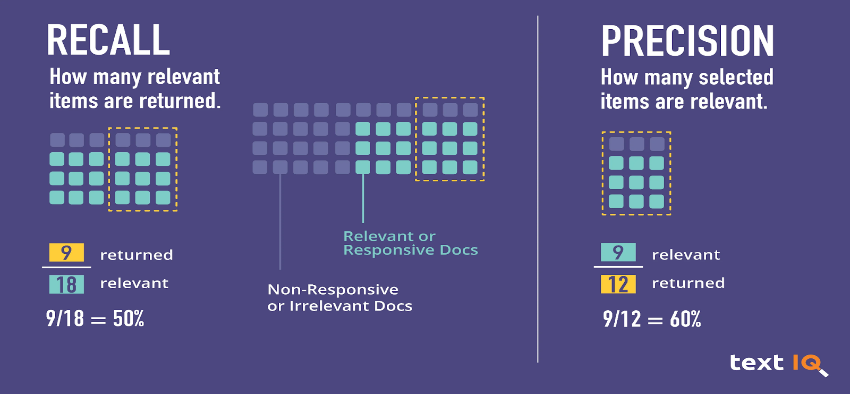
Average Precision
Average precision computes the average precision value for recall values over 0 to 1.
Mean Average Precision (mAP)
The mAP is the mean of the average precision scores and is used as a metric for instance segmentation to measure how accurate the predictions are at the pixel level. Values for mAP evaluation lie between 0 and 1.

Data set Requirements
Semantic Segmentation
Semantic Segmentation requires an associated PNG file with a mask for each image file. The masks identify each class by its respective RGB color.
Input images must be of identical height and weight dimensions. The minimum image dimensions for effectively training semantic segmentation models are 512x512px. As your dataset increases in several files, this 512x512px can cause memory issues without sufficient GPU processing power. To overcome memory issues our machine learning engineers experiment with smaller images (256x256px), We observed that the size of the input matters greatly to the key model performance metrics, notably Intersection over Union (IoU).

Your data set directory structure should look similar to this set-up:
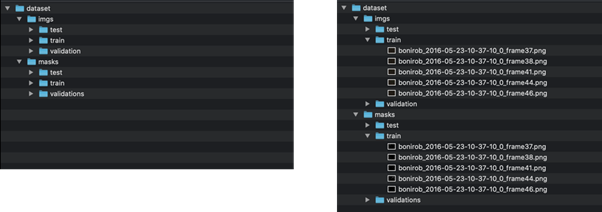
Each image file should correspond with an identically named mask placed in the respective train/test/validation masks directory to avoid filename conflict.
We were able to acquire high-quality weed /crop semantic segmentation maps via a subset of the publicly available Sugar Beets data set produced by the University of Bonn.
Instance Segmentation
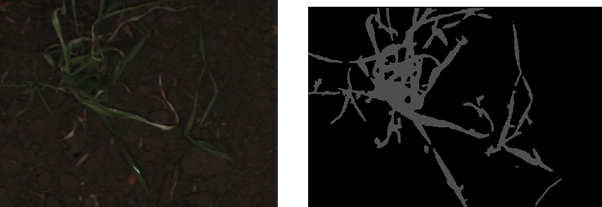
Mask R-CNN requires the training data set to be annotated in COCO format. These types of annotations identify the specific outline of each instance using a series of x,y coordinates. COCO annotations provide pixel-specific locations of each instance, with each instance being designated its own color of the translucent mask.

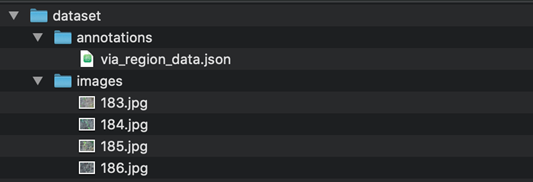
Input images can have varying dimensions such as 1024 x 768. The output file generated from COCO annotated images is one JSON file, irrespective of how many image files were annotated.
Example COCO Annotation file below:

An example of how your data set directory should be structured:
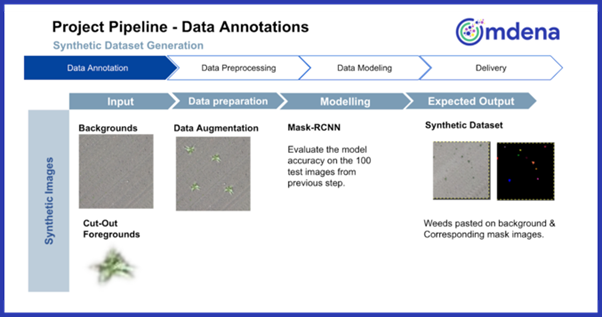
As there were not publicly available, large COCO datasets available of crop vs weed we had to construct our own via synthetic data generation techniques. This process involved hand labeling samples with pixel-wise COCO coordinates of weed vs crop, extracting those foregrounds, programmatically copying and pasting the foregrounds to random selections of relevant soil backgrounds, while using various data augmentations (rotate, scale, etc.) to expand on our sparse baseline data set.
In this research work, we explored different segmentation models: baseline U-Net, U-Net model with EfficientNet, U-Net model with MobileNet, Mask R-CNN with ResNet101 backbone, and Mask R-CNN with ResNet50 backbone.
EfficientNets uses Compound Scaling – that is, scale all three dimensions while maintaining a balance between all dimensions of the network. Therefore, it has a significant improvement in performance as compared to other CNNs.
We also tested MobileNet, a depth-wise separable convolution, which dramatically reduces the complexity, cost, and model size of the network. The faster the speed and lighter the model, the more suitable it will be for real-time applications and embedded learning. The model performance is comparatively lower compared to the EfficientNet model and other U-Net models due to a decrease in the model size of the network.
We also trained and evaluated an instance segmentation convolutional neural network (mask R-CNN model) aimed at segmenting and identifying each plant specimen visible in images. It uses a selective search algorithm to generate a region proposal and help detect objects in an image.
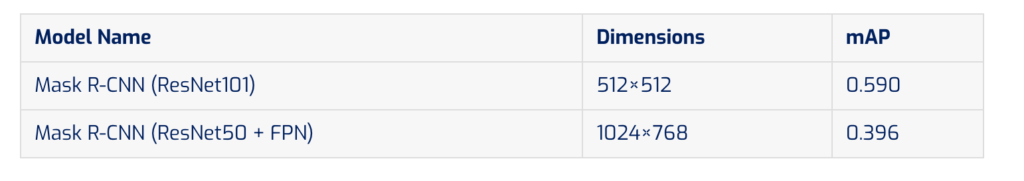
We chose ResNet‐50 and ResNet-101 as the backbone CNN and Feature Pyramid Networks for instance segmentation. To prevent over-fitting and under-fitting by the model, we made extensive use of batch normalization. Batch normalization is currently the most effective and popular regularization technique in deep learning. Mask R-CNN (ResNet101) performance is better than ResNet-50 because the training effect of Resnet50 shows that the smallest loss is high and mAP is lower than the one in ResNet-101. Compared to Semantic Segmentation we observed high variability of performance in the Instance Segmentation models across the different categories. The plant size had a significant impact on performance. The higher probability of misdetection for the small objects is due to a bias rather than a problem of resolution.
Model Performance
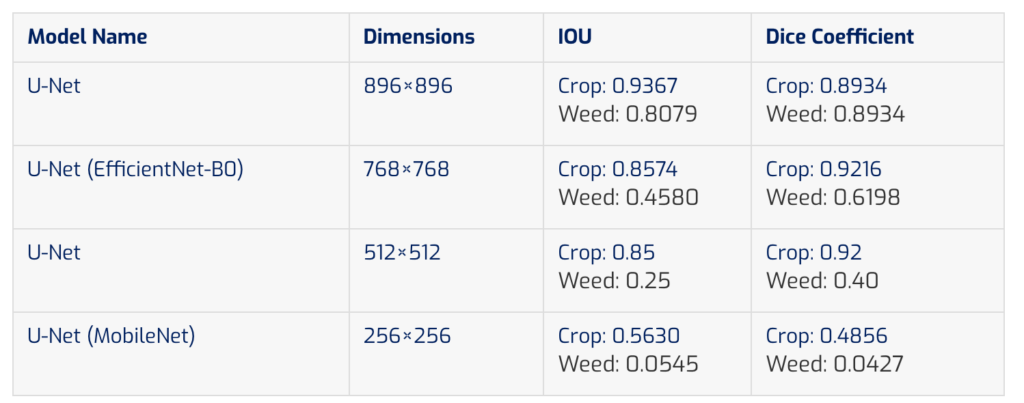
The Dice Coefficient shows the superior ability of U-Net- EfficientNet in segmenting crops/weeds compared to the other methods. Baseline U-Net shows better results as a multi-class segmenter (with 0.9367 IOU).
Overview of Model Performance Metrics Across all Segmentation Tasks
Semantic Segmentation Performance
Instance Segmentation Performance
Analysis of Results
Semantic segmentation models performed better than instance segmentation in segmenting crops vs weeds. The two main reasons are the data set sample size and the plant/weed sizes within the COCO data set that we used for instance segmentation. The COCO data set was significantly smaller than the baseline segmentation data set, and model performance deteriorated as a result. The main impediment to improving our Mask R-CNN model performance was data limitations. A quality COCO data set for weed and crop instance segmentation was not as readily available as the one we acquired for semantic segmentation.
Creating a custom weed/crop COCO data set involved painstaking and laborious pixel-by-pixel hand labeling. Therefore, it was not realistic to produce a comprehensive data set within our project’s timeline. Furthermore, despite honing various synthetic data generation techniques to overcome this challenge, the COCO annotation style does not apply well to images of weeds. The weeds’ “wispy” contours make pinpointing the specific instances of each unique class very difficult, which in turn makes both natural and synthetic generation in COCO format virtually impossible.
Bonus: Useful Resources
COCO Annotations in CVAT
Check out our video on how to produce custom COCO annotated datasets in CVAT.
COCO Viewer
Our team found a simple notebook for visualizing your COCO annotations in Jupyter or Google Colab courtesy of https://github.com/akTwelve

Conclusion:
In this challenge we explored different segmentation techniques, data set requirements to detect crops and weeds using drone imagery. In our research semantic segmentation models performed better than instance segmentation in segmenting crops vs weeds. The two main reasons are the data set sample size and the plant/weed sizes within the COCO data set that we used for instance segmentation. The COCO data set was significantly smaller than the baseline segmentation data set, and model performance of instance segmentation deteriorated as a result compared to semantic segmentation.
We want to thank all the Omdena collaborators with whom we have worked and learned so much in the past two months. Labor-intensive, because working on such a project with real-world data and so many collaborators from all around the world was a unique and amazing experience.
